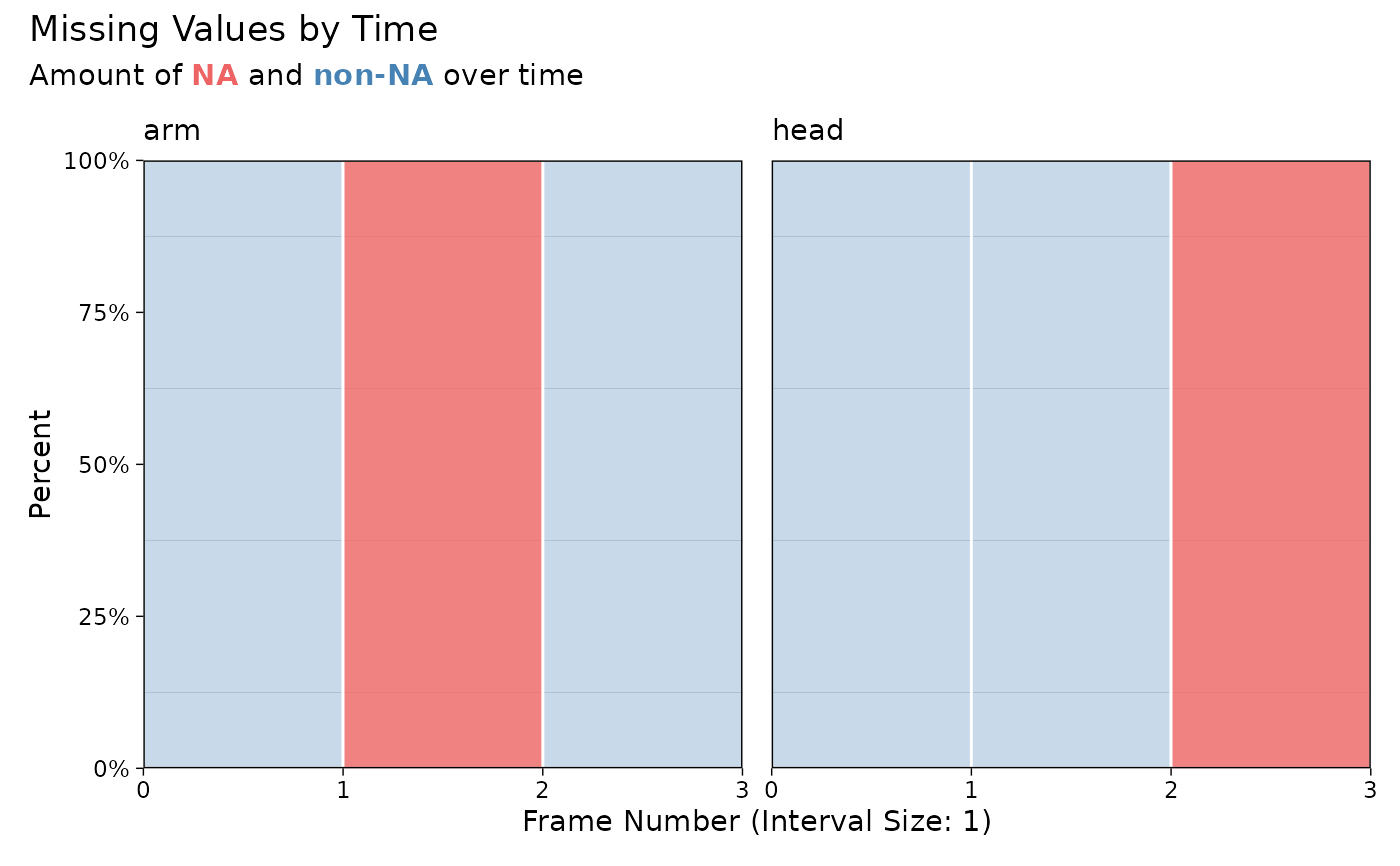
This function generates a plot to visualize where missing values (NAs) occur
in the data over time. It can display separate plots for each keypoint or a
single aggregated plot for all keypoints.
Usage
check_na_timing(data, by_keypoint = TRUE)
Arguments
- data
A data frame containing at least the columns x, individual,
and keypoint.
- by_keypoint
Logical. If TRUE, generates a separate plot for each keypoint.
If FALSE, creates a single aggregated plot for all keypoints. Default is TRUE.
Value
A patchwork object combining one or more ggplots that show the
timing of missing values (NA) in the data.
Details
Missing values are highlighted using a red (indianred2) color, and non-missing
values are shown in blue (steelblue).
The function uses the patchwork package to combine multiple plots when by_keypoint = TRUE.
Examples
library(dplyr)
library(ggplot2)
library(patchwork)
data <- dplyr::tibble(
  x = c(1, 2, NA, 4, NA, 6),
  individual = rep("A", 6),
  keypoint = factor(rep(c("head", "arm"), each = 3))
)
check_na_timing(data, by_keypoint = TRUE)