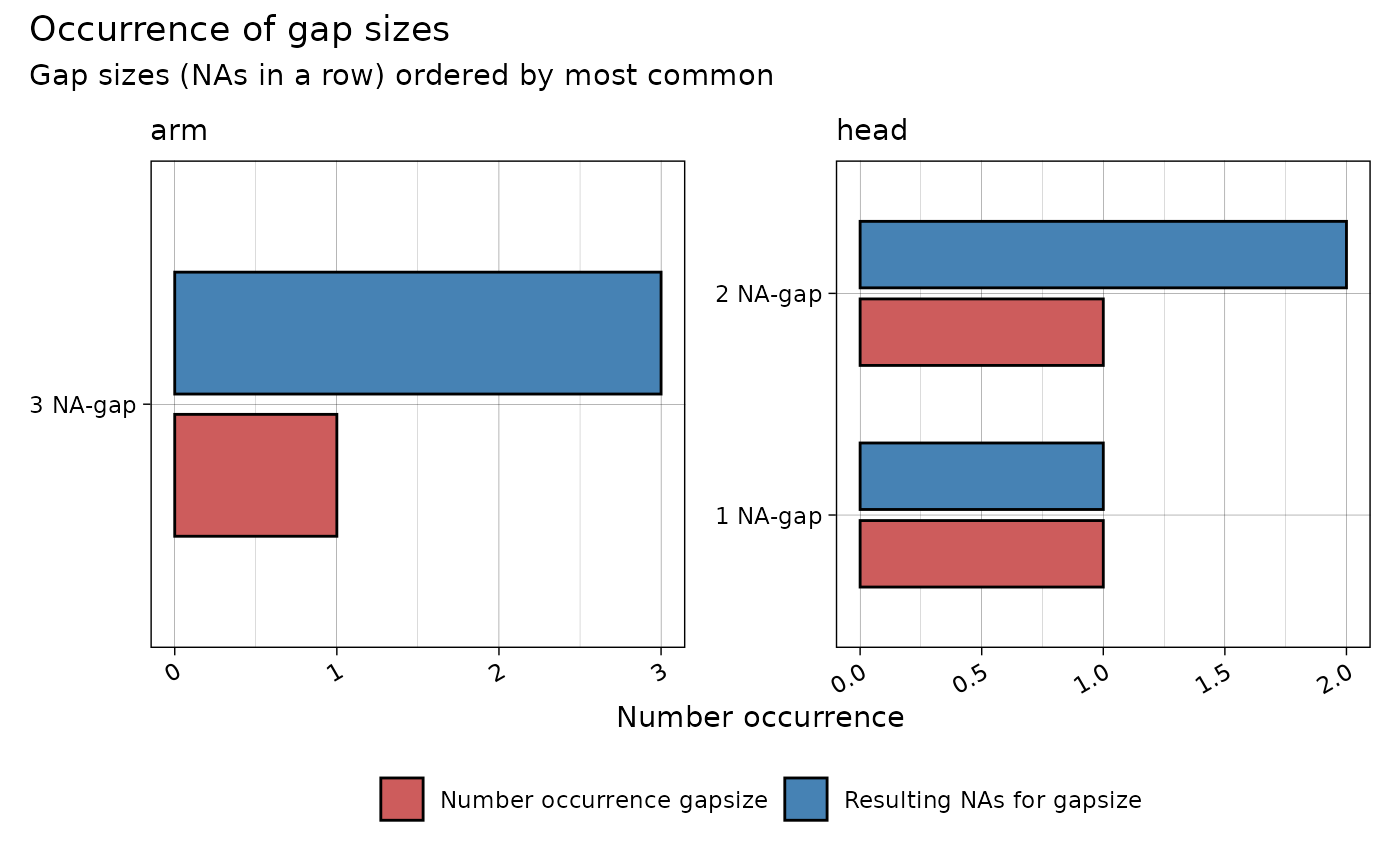
This function generates a plot showing the distribution of gap sizes (consecutive
NA values) in the data, either aggregated or broken down by keypoints.
Arguments
- data
A data frame containing at least the columns
xandkeypoint.- limit
An integer specifying the maximum gap size to include in the plot. Default is 10.
- include_total
Logical. If
TRUE, includes the total count of gaps of each size in the plot. Default isTRUE.- by_keypoint
Logical. If
TRUE, generates a separate plot for each keypoint. IfFALSE, creates a single aggregated plot for all keypoints. Default isTRUE.
Value
A patchwork object combining one or more ggplots that visualize the
occurrence of gap sizes (consecutive NAs) in the data.