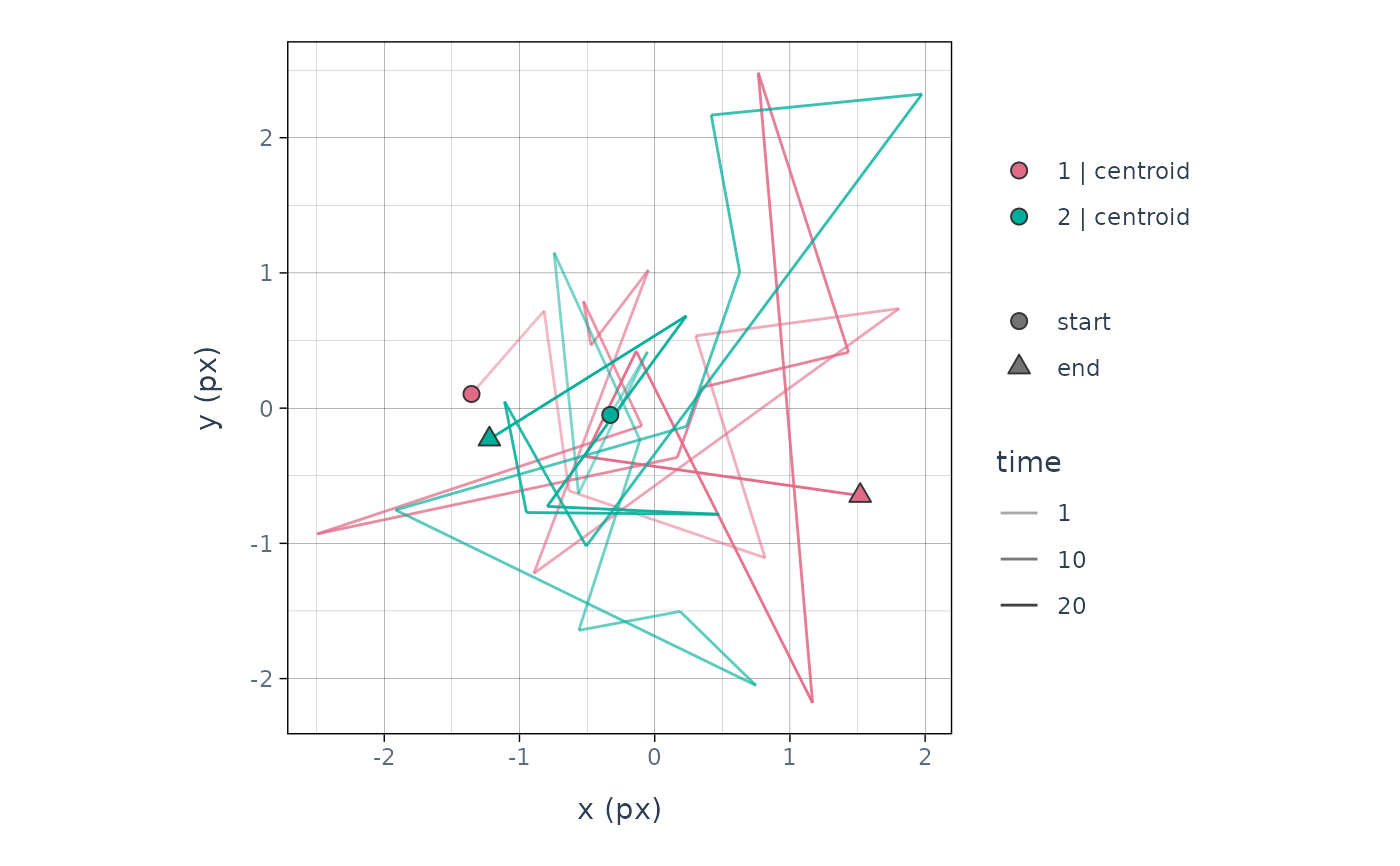
Creates a visualization of movement data stored in an
anicore::anipoint(). Returns a patchwork object that can be combined with
additional plots.
Today the figure is the trajectory alone, drawn by plot_trajectory(). What
plot() shows may change without a deprecation cycle, for example to add
speed and course traces beneath the path. Call plot_trajectory() directly
when you need exactly that plot.
Arguments
- x
An anipoint object.
- ...
Additional arguments passed to underlying plot functions.
- mode
Either
"light"(default) or"dark"; passed toplot_trajectory().
Examples
af <- anicore::example_anipoint(n_obs = 20, n_individuals = 2, n_keypoints = 1)
plot(af)