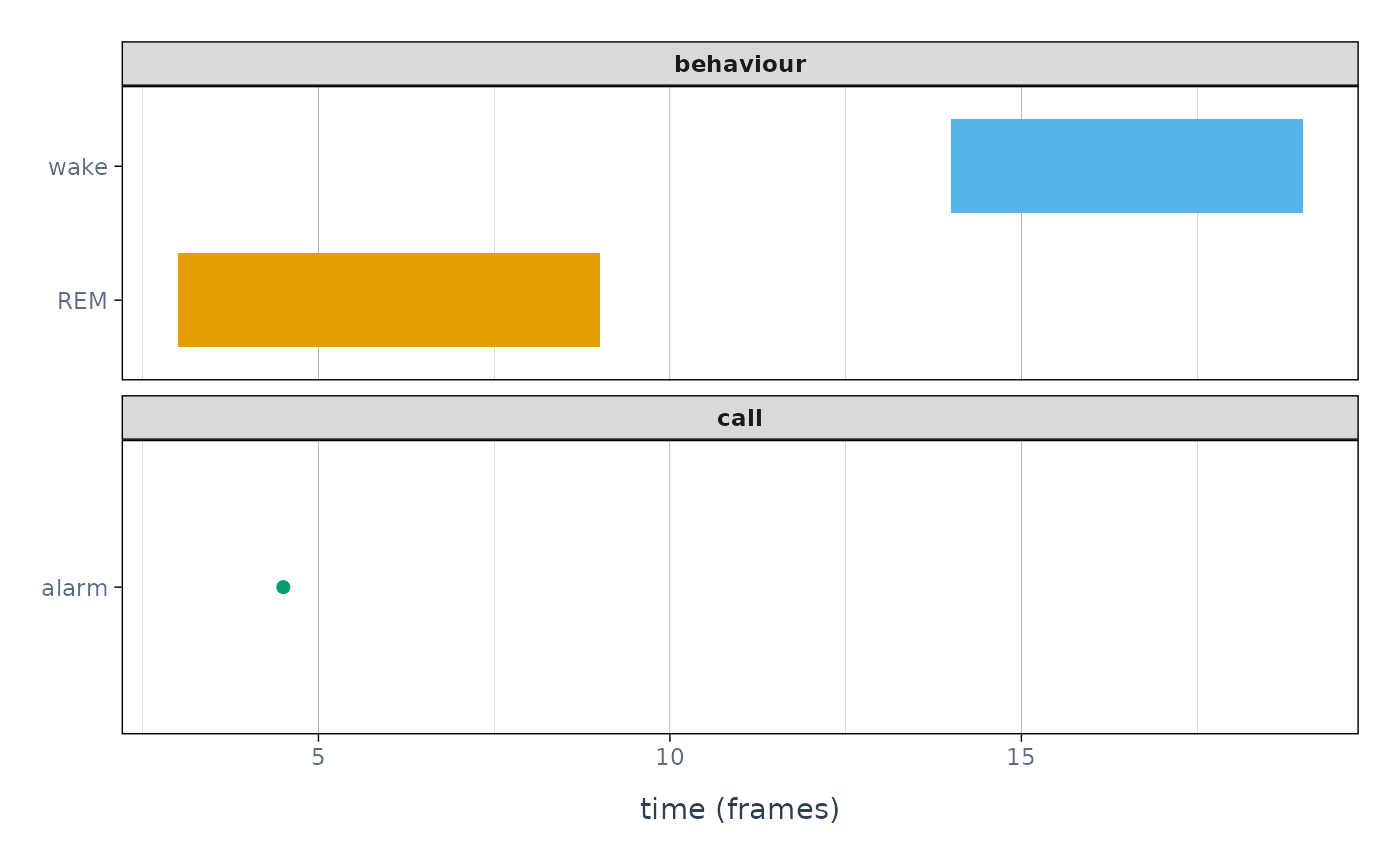
Creates a visualization of state and point events from an
anicore::anievent() using geom_event_state() and
geom_event_point(). Returns a patchwork object that can be combined
with additional plots. The drawing itself is done by plot_events().
Arguments
- x
An anievent object.
- ...
Additional arguments passed to underlying plot functions.
- mode
Either
"light"(default) or"dark"; passed totheme_animovement().