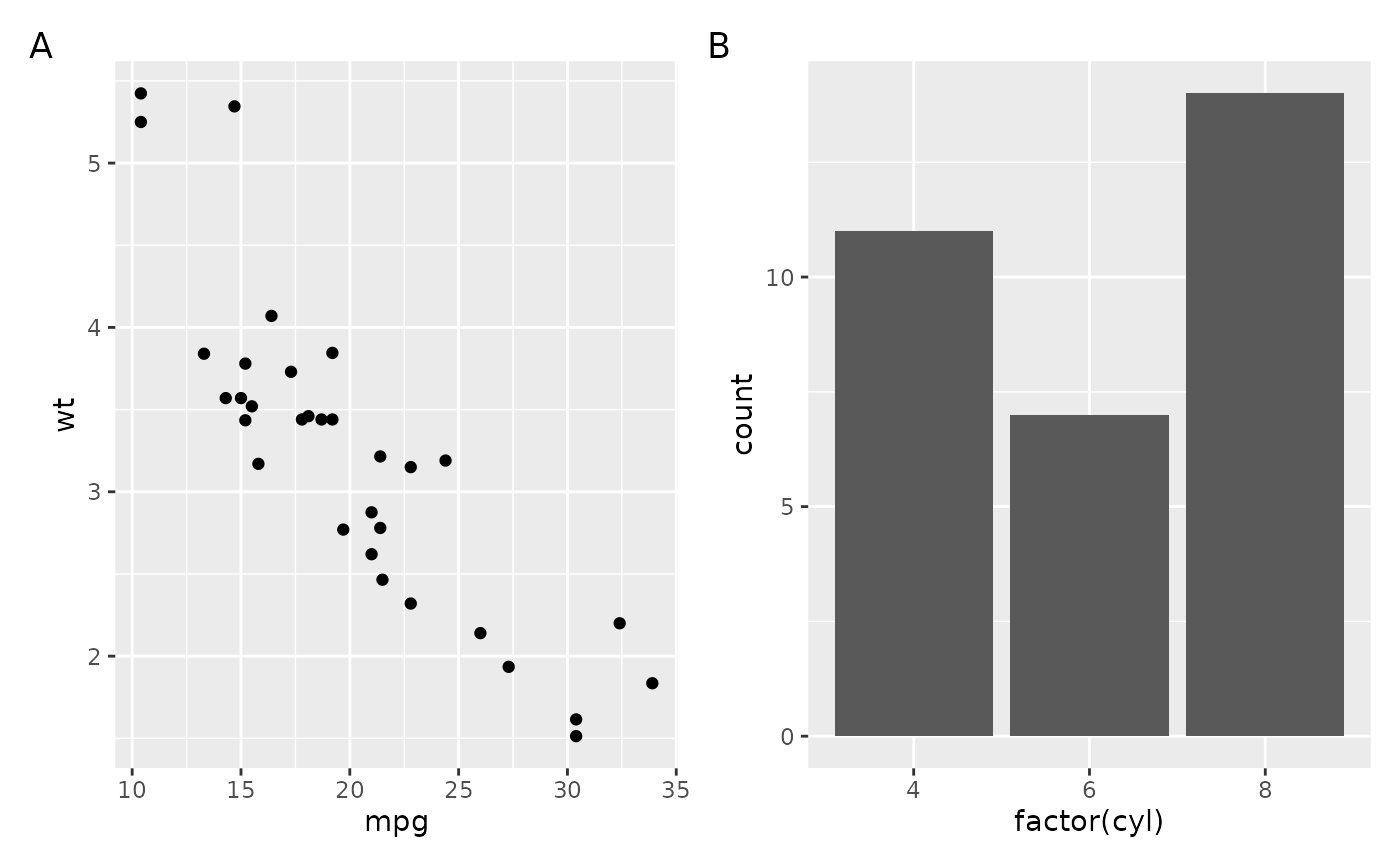
A thin convenience wrapper around patchwork for composing several plots into a single figure with optional sub-figure tags, a shared legend, and an overall title / subtitle / caption. Vendored from the see package so anivis plots can be combined without reaching for patchwork directly.
Usage
plots(
  ...,
  n_rows = NULL,
  n_columns = NULL,
  guides = NULL,
  axes = NULL,
  axis_titles = NULL,
  tags = FALSE,
  tag_prefix = NULL,
  tag_suffix = NULL,
  tag_sep = NULL,
  title = NULL,
  subtitle = NULL,
  caption = NULL,
  theme = NULL
)
Arguments
- ...
Plots to combine, or a single
listof plots.- n_rows, n_columns
Number of rows / columns in the layout. By default patchwork chooses a roughly square grid.
- guides
How to treat legends:
"collect"to pool identical legends into one,"keep"to leave them in place. Passed topatchwork::wrap_plots().- axes, axis_titles
How to treat duplicated axes / axis titles:
"collect","collect_x","collect_y"to share them across aligned panels, or"keep"(default). Passed topatchwork::wrap_plots().Sub-figure tags.
TRUElabels panelsA,B,C, ...; a character vector such asc("1", "2")or"i"chooses another sequence;FALSE(default) adds none.- tag_prefix, tag_suffix, tag_sep
Strings placed before / after each tag, and the separator between nested tag levels.
- title, subtitle, caption
Overall annotations for the combined figure.
- theme
A ggplot2 theme applied to the annotations (e.g. the title).