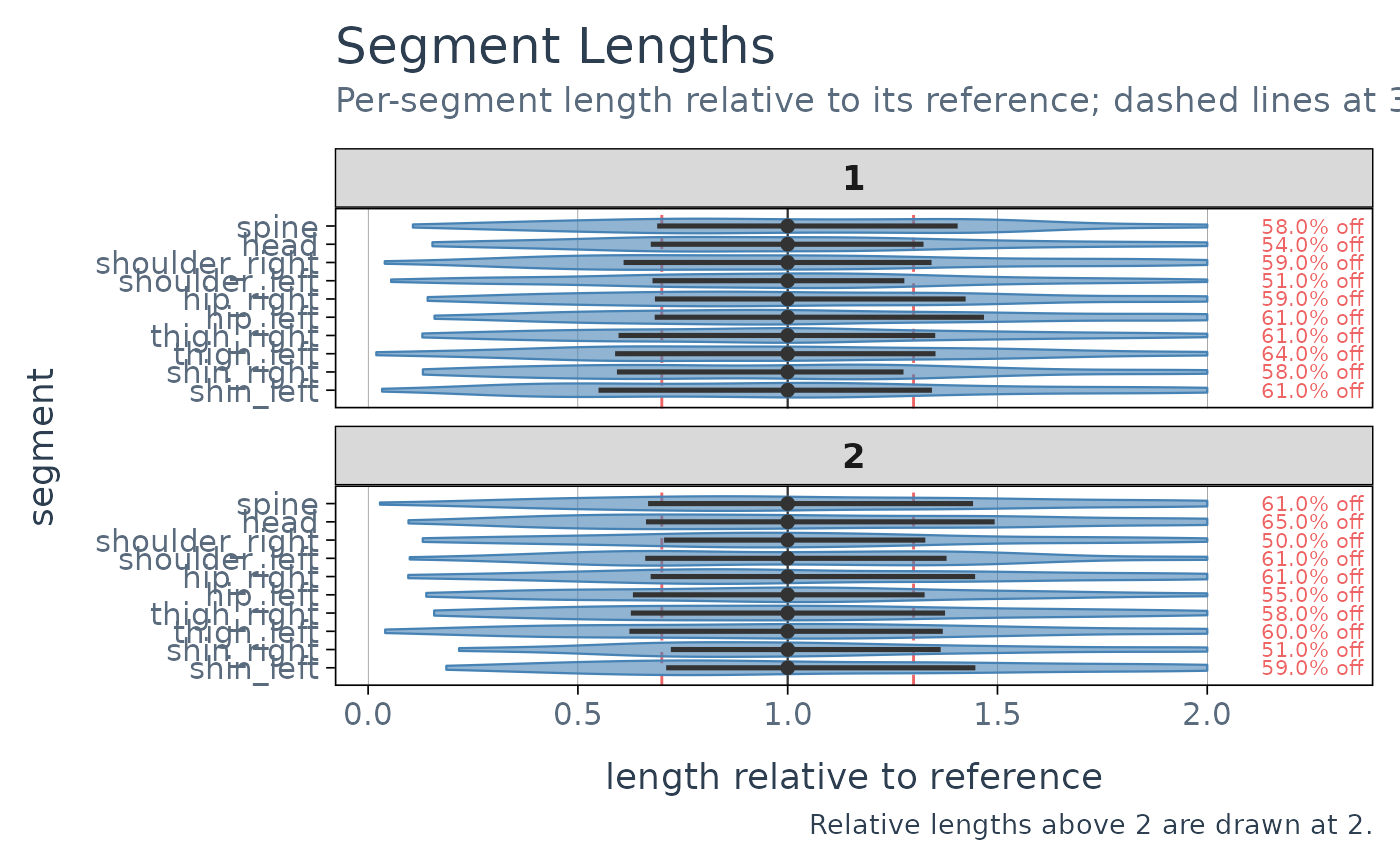
Plot how much segments vary from their usual length
Source:R/plot.check_segment_length.R
plot.anivis_check_segment_length.Rd
Renders a check_segment_length() result (from the anicheck package) as a
horizontal violin per segment of its length relative to its reference
(segments on the y axis, relative length on the x), with a point at the
median and a line spanning the inter-quartile range. A solid line marks the
reference (1) and dashed lines the check's tolerance either side of it, and
the share of frames beyond them is written at the right of each segment
that has any. A segment that keeps its length is a narrow violin on the
solid line; a wide one, or one reaching past the dashed lines, is a segment
the tracking gets wrong. Segments run top to bottom in the structure's
order, and with several individuals, each gets its own panel.
The violins are drawn from the kernel-density grid stored in the check
object (via geom_polygon), so no raw lengths are needed. The check enters
relative lengths above its clamp (2, unless the tolerance is large) into
that grid at the clamp, so a segment with a few wild frames shows a bump at
the right edge rather than stretching the axis; the plot's caption says so
when it happens. Styling matches the other check plots (theme_imputets(),
vertical gridlines only). The plot is built from an intermediate frame of
class anivis_check_segment_length_data produced by as_plot_data() — the
staging step that mirrors data_plot() in see.
Arguments
- x
A
check_segment_lengthobject (from the anicheck package).- ...
Additional arguments (currently unused).
- clip
Cut each violin where its density falls below this fraction of its peak (default
0.02), so thin tails and the neck bridging a bimodal distribution are removed. Set0to keep the full density.- mode
Either
"light"(default) or"dark"; passed totheme_imputets().
Examples
af <- anicore::example_anipoint(n_obs = 100, n_individuals = 2) |>
  anicore::set_structure(anicore::example_structure())
plot(anicheck::check_segment_length(af))